I recently blogged about cluster configuration options in Spark and how you can maximize compute utilization and processing time. Of the many options that I listed and data provided, I never gave any benchmarks comparing RunMultiple and Multithreading. The goal of this post is exactly that, drilling into real data that pushes the concurrency limits of both. Going forward I’ll reference Multithreading simply as ThreadPools since that is the specific Multithreading implementation that I’ll be testing.
The RunMultiple vs. ThreadPools Showdown
Methodology
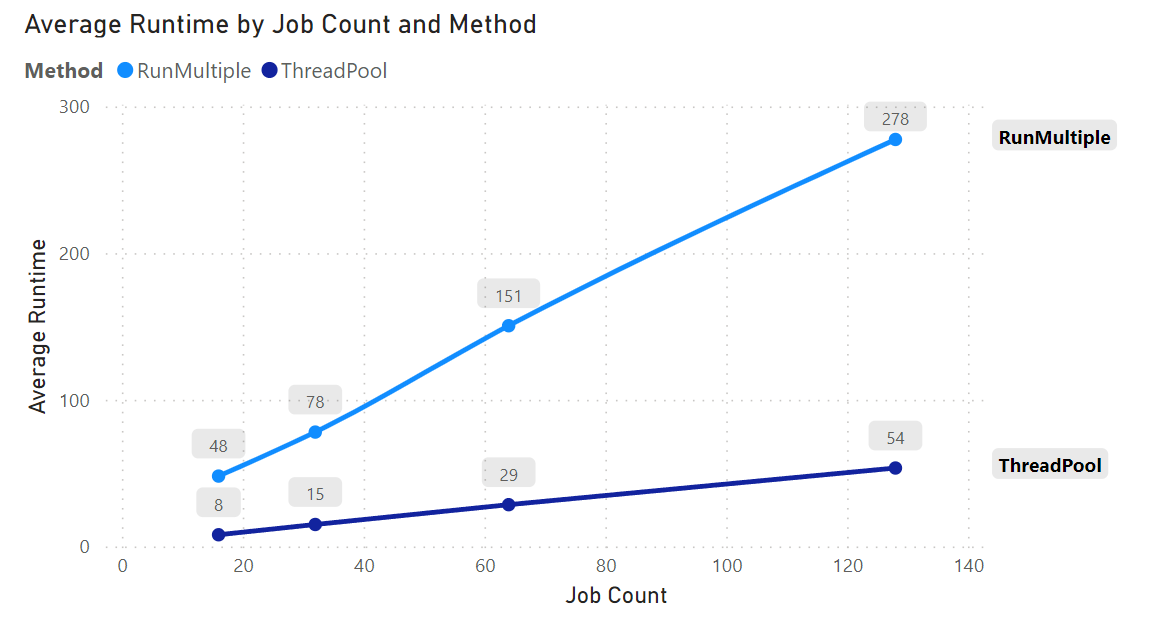
To compare the performance of the two methods, I ran concurrent instances of a synthetic write operation, scaling from 16, 32, 64, and finally to 128 concurrent jobs. The number of jobs was set to equal the defined concurrency for both methods.
Setting up the Benchmark
There were three primary things I did to set this up:
-
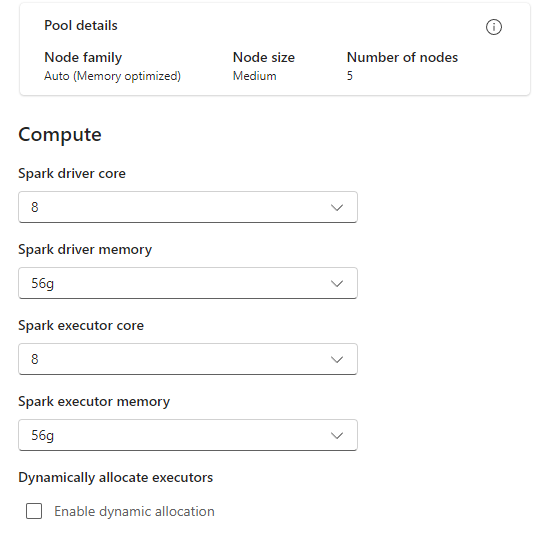
Configure the Spark Pool to have sufficient nodes (5 total for 1 driver and 4 executors) and disable Dynamic Allocation to ensure that a fixed number of executors is used for each cluster config. Enabling Dynamic Allocation with a min and max of 4 executors still results in having potentially less than 4 executors allocated to the session.
- Create a parent Notebook for executing both RunMultiple and ThreadPoolExecutor jobs.
- Create a child Notebook with a simple parquet write operation which the RunMultiple command will call.
The below code cell in the Parent Notebook defines the execution config of the tests.
import concurrent.futures
import pyspark.sql.functions as sf

spark.conf.set("spark.notebookutils.runmultiple.limit", 128)

instances = spark.conf.get("spark.executor.instances")
cores = spark.conf.get("spark.executor.cores")
print(f"{instances}x{cores}")

jobs = 128
concurrency = jobs
As noted in the Microsoft Documentation, the default upper limit of jobs that a RunMultiple command can support is 50. You can increase the limit as I did, however, there is a risk of stability and performance issues. I did have 3 instances of a
Fail to start interpreter pysparkerror and increasing cell timeouts when I went above 50, I was able to mitigate the cell timeouts failures by setting an unreasonably large cell timeout (timeoutPerCellInSecondsbelow) but was not able to mitigate the failure to start the interpreter.
In the below code, I use Python list comprehension to dynamically generate the RunMultuiple DAG based on the defined jobs value.
dag = {
    "activities": [
        {
            "name": f"Notebook{i}",
            "path": "RunMultiple_ChildJob",
            "timeoutPerCellInSeconds": 240,
            "args": {"job_id": i}
        }
        for i in range(1, jobs + 1)
    ],
    "concurrency": concurrency
}
mssparkutils.notebook.runMultiple(dag)
The last block of code is everything that runs for the ThreadPool method. We define a function (write_job()) and then submit futures that call the function. The function generates a synthetic dataframe with 1M records that has a surrogate key and literal ID of the job. The child notebook for the RunMultiple has the same function.
def write_job(job_id):
    df = spark.range(1000000)
    df = df.withColumn("sk", sf.monotonically_increasing_id()).withColumn("instance_id", sf.lit(job_id)).drop("id")
    df.write.mode("overwrite").parquet(f"abfss://<guid>@onelake.dfs.fabric.microsoft.com/<guid>/Files/benchmark/multithreading/{job_id}/")
    print(f"done: {job_id}")

with concurrent.futures.ThreadPoolExecutor(max_workers=concurrency) as executor:
    # Submit all jobs to the executor
    futures = [executor.submit(write_job, job_id) for job_id in range(jobs)]
Results
ThreadPools destroy RunMultiple on the performance side of things. Regardless of the cluster config and number of concurrent jobs executed, ThreadPools consistently completed all operations about 5x faster than the RunMultiple command.
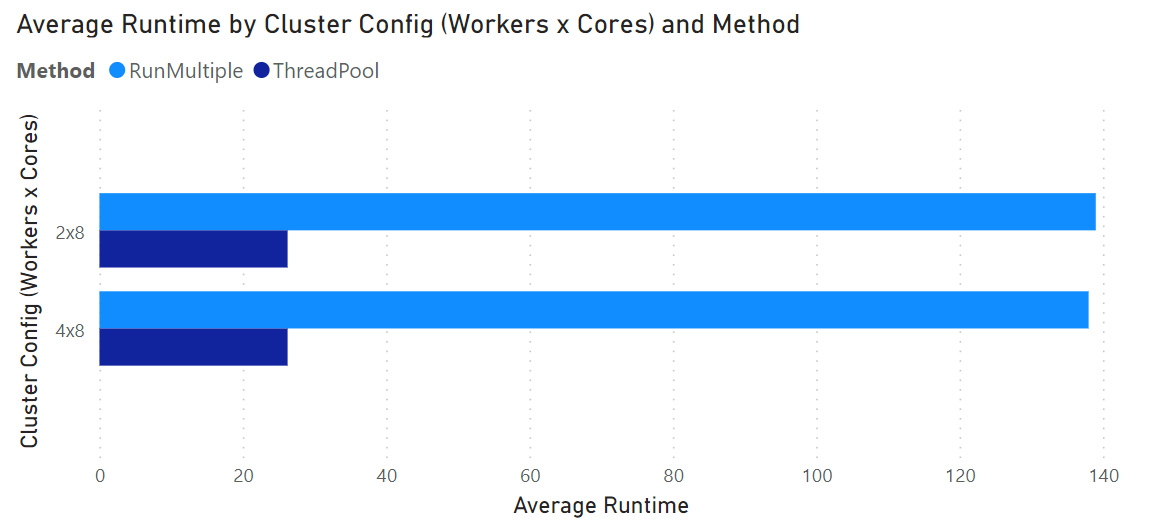
I did test all concurrency levels on both 2x8 and 4x8 clusters, and as seen below, the results are nearly identical. I interpret the lack of improvement when increasing the number of executors is due to the reality that the workload of generating 1M rows of synthetic data is just too light to see an improvement with having more CPUs available. Additionally, the driver node may have been limiting the possible improvement in managing more threads when approaching the high end of my concurrency tests.
Observations
Performance
As I monitored the execution of the RunMultiple method, it appeared very clear that the real concurrency of the method (regardless of the concurrency you define as a DAG parameter) is limited by the number of executors in your cluster. With the 2x8 configuration (2 executors, each with 8 cores), the progress bar movement indicated that only two cell blocks of the child notebook were being run at one time. Likewise, with the 4x8 configuration, the progress visualization appeared to show that only 4 jobs were making progress at a given moment. While I can’t confirm the actual inner workings of RunMultiple at this time, the behavior appears to work just like High-Concurrency (HC) clusters. With HC cluster mode, your concurrency is limited by the number of executors, however, it can appear like more is happening at one time as blocks of code in the Notebooks sharing the cluster effectively take turns executing. This is an important consideration though as this means that multiple jobs are not able to share resources within a single executor, this can result in inefficient utilization of executor resources in addition to processes taking longer than they should, simply because they spend time queuing waiting for an executor to come available.
Why was the ThreadPool method so much faster? ThreadPool threads are not bound to a single executor, this means that multiple threads can be running on a single Executor at once where they share available resources rather than reserve and block.
Monitoring UI / UX
RunMultiple provides a significantly better user experience and interface for monitoring jobs. As seen in the GIF below, the UI has improved a lot lately to now include Fabric custom monitoring to show the progress of each task in addition to the ability to click into each to see the Notebook snapshot. One downside is that it does seem to take additional time just to track the completion of the Notebook snapshot. You’ll notice that runs will show as successful before the final duration is logged. This logging does prevent further cells from starting to execute.
These Notebook snapshots also show up in the spark monitoring experience.
ThreadPools on the other hand require the user to code logging functionality from scratch. Of course, this is entirely expected, ThreadPools as found in the Concurrent.Futures library is nothing more than a super powerful suite of methods for concurrent thread and process management. Building similar progress bar tracking capabilities as well as the ability to cancel in-progress or not yet stated futures requires advanced Python coding skills and significant time for building and testing the framework.
Development Pattern
A few comments about the development pattern implications of each:
- I like being able to programmatically generate a DAG for RunMultiple.
- I don’t like that the code has to be in another notebook. In the scenario where you have a library-based data engineering framework, spitting portions of your code across different Notebooks seems a bit clumsy as the additional Notebooks only serve as a container for the concurrency executed code.
Closing Thoughts
Is the RunMultiple monitoring experience worth a 5x slower* solution? Ultimately, the actual performance and derived value will depend on your workload and capability, however, I believe it is significant enough to make it worth testing more code-intensive methods like multithreading via the Concurrent.Futures library, especially if you have the Python experience. RunMultiple is a fantastic Fabric Spark utility which I will certainly be using, but not for every use case that requires concurrency management.
Additionally, I hope this post shows how it is worth exploring other methods for executing your code, just because a new feature that seeks to make data engineering less complicated is available, doesn’t mean that it’s the most performant option for your workload.